Labor Power in Mexico: Who Hires, Who Manages, and Who Works
An analysis of Mexico's labor market distribution, revealing power dynamics in hiring, management, and workforce roles.
In any setting where work is generated—be it a factory, an office, a farm, or a neighborhood shop—there exists a structure that determines who makes decisions and who executes them. This hierarchy is not always explicit, but the numbers reveal it clearly. Every quarter, the National Occupation and Employment Survey (ENOE) from the National Institute of Statistics and Geography (INEGI) provides a snapshot of the Mexican labor market, allowing for a clear identification, with figures, of how power is distributed within the workforce: who hires, who manages, and who works.## The Pyramid: Three Layers, Vastly Different Proportions
ENOE data from the fourth quarter of 2025 indicates that the employed population in Mexico totaled nearly 60 million people (59,785,854 to be exact). Of this universe, a mere 6% are employers, approximately 2% are officials and managers, and nearly seven out of ten are subordinate workers. Viewed collectively, this distribution forms a pyramid with a broad base and a very narrow apex, where the decision-making capacity is concentrated in a small fraction of the total.## The Apex: Those Who Hire
According to the ENOE for the fourth quarter of 2025, 3,572,775 individuals hold the category of employer. This means they own means of production and have workers under their charge. They represent 6% of the employed population.
This group holds the most structural decision-making power in the labor market: hiring. They are the ones who create the positions accessible to the rest of the workforce. This figure implies that, on average, for every employer in Mexico, there are slightly more than eleven subordinate workers. In terms of market size, this proportion speaks to an ecosystem where job creation capacity rests in the hands of a minority.## The Middle Management: Those Who Direct
Between those who hire and those who work in subordinate positions, there is an occupational layer with its own characteristics: officials and managers. The National System of Occupational Classification 2019 (SINCO) from INEGI groups this segment under Division 1, which encompasses occupations that “plan, coordinate, direct, and evaluate the general functions of private, social, or governmental enterprises and organizations at the national, state, and/or municipal level,” as described by the classifier itself.
The interactive tables of the ENOE for the fourth quarter of 2025 show that the group of “Officials and managers in public, private, and social sectors” totals 1,117,439 individuals, equivalent to 1.9% of the employed population. This segment includes general directors, area managers, coordinators, and chiefs, from both the public, private, and social sectors.
What distinguishes this group is not ownership, but function. SINCO emphasizes that the classification criterion is the “level of responsibility”: they are the ones who make decisions that have a broader impact within an organization than those of other workers. Many of them are, in terms of their job position, subordinate workers; they have superiors above them but also direct large teams below them. Their power derives from hierarchy, not ownership.
The proportion illustrates this precisely: for every official or manager, there are approximately 37 subordinate workers in the Mexican economy.## The Base: Those Who Work
The category with the largest numerical weight is that of subordinate and paid workers. According to the ENOE from the fourth quarter of 2025, this group totals 41,248,865 individuals and represents 69% of the employed population. These are individuals who hold a position within an organization, receive remuneration, and are subject to a hierarchical relationship with an employer or manager.
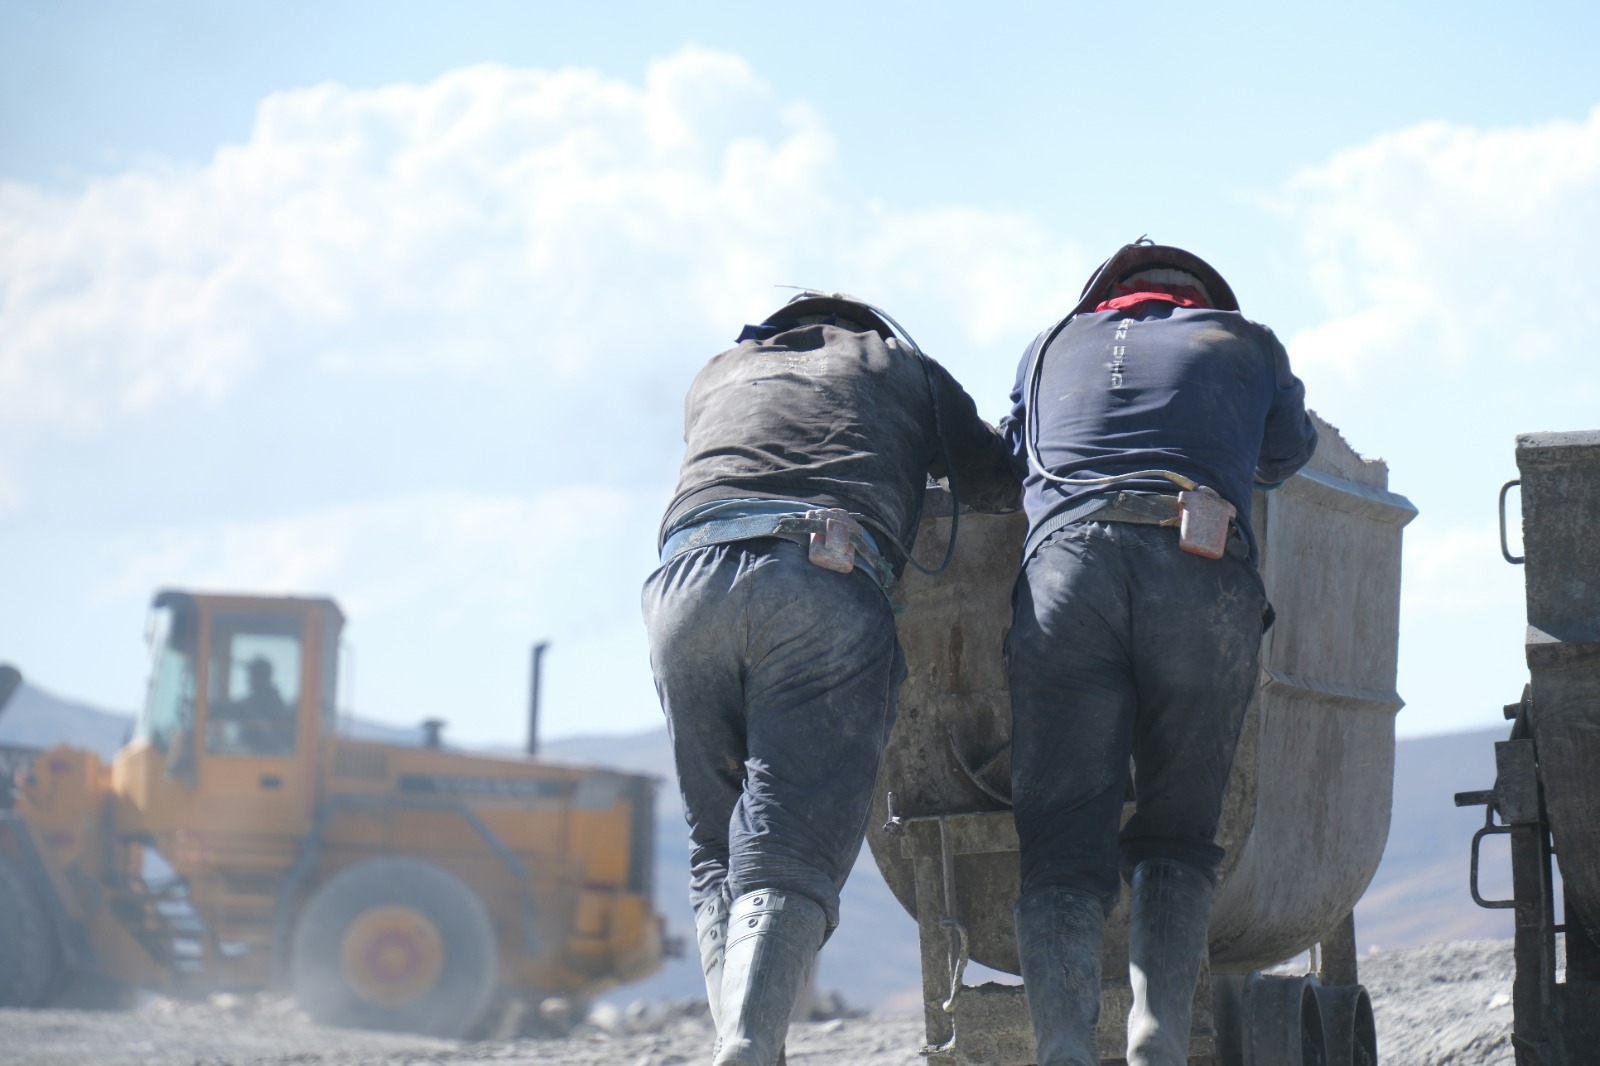
This figure operationally sustains the country’s labor market. They are the ones who manufacture, provide services, serve customers, build infrastructure, and execute the decisions made in the upper layers of the pyramid. Their relative size confirms that the vast majority of Mexicans who work do so under a formal dependency structure.## Beyond the Pyramid: Self-Employed and Unpaid Workers
Not all of the workforce fits into the classic employer-employee relationship. According to the same survey, 12,980,516 individuals work for themselves without hiring paid staff, accounting for 21.7% of the total. In addition, there are 1,983,698 unpaid workers (3.3%), individuals who participate in productive processes in family businesses or plots without receiving monetary payment.
Together, these two groups represent a quarter of the employed population operating on the margins of the formal pyramid. They neither hire nor are they formally hired, and their presence reflects the weight of self-employment and household economies within the Mexican labor market.## The Complete Distribution: All Segments of the Labor Market
The five groups into which ENOE classifies the employed population offer a more complete panorama than the three-layer pyramid. The following table consolidates each category with its absolute and relative weight within the labor market for the fourth quarter of 2025, and incorporates the category of senior management derived from the SINCO 2019 occupational groups.
| Category | Function | People | % of Total |
|---|---|---|---|
| Employers | Those who hire and own means of production | 3,572,775 | 6.0% |
| Officials and Managers* | Those who direct and coordinate organizations | 1,117,439 | 1.9% |
| Subordinate and Paid Workers | Those who execute within a formal employment relationship | 41,248,865 | 69.0% |
| Self-Employed Workers | Those who work independently without hiring staff | 12,980,516 | 21.7% |
| Unpaid Workers | Those who contribute to family businesses or plots without monetary payment (official) | 1,983,698 | 3.3% |
| Total Employed Population | 59,785,854 | 100% |
*Officials and managers are measured from the occupational group dimension (SINCO 2019, Division 1), not by position within an occupation. Therefore, they are not independently summed into the total; the majority are classified within subordinate and paid workers.
What the Distribution Reveals
ENOE figures reveal a marked concentration of decision-making power within the labor market. The 6% who employ and the 2% who formally manage represent, collectively, less than a tenth of the workforce; however, their decisions determine the conditions under which 69% of subordinate workers operate.
An additional dimension is added to this concentration of formal power. According to the survey for the same quarter, 55% of the employed population works under informal labor conditions, equivalent to 32,884,825 people. This means that for more than half of the workforce, the labor market structures operate outside formal regulation mechanisms: written contracts, social security, and guaranteed minimum wages.
The size of businesses adds another nuance: of the total workers in the non-agricultural sector, 48.7% labor in micro-businesses, establishments with one to five employees in commerce and services, or up to 15 in industry. In these spaces, the role of employer and manager frequently falls to the same person, blurring the distinctions that the formal labor market establishes between those who hire and those who manage.
INEGI’s data thus portrays a labor market where the power to decide who works, under what conditions, and with what direction is distributed very asymmetrically: a broad base that executes, a thin layer that coordinates, and a small apex that hires. The entry
appears first on Líder Empresarial.
More Articles

Automotive Supplier 2026: Monterrey to Convene Automotive Industry Leaders
Apr 20, 2026

Automotive Industry Supply Summit 2026 Solidifies Querétaro as Automotive Hub
May 8, 2026

Why Construction is Sustaining Jalisco's Industry in 2026
May 12, 2026
Labor Power in Mexico: Who Hires, Who Manages, and Who Works
May 18, 2026

GPTW Certified Companies 2026: Labor Practices Transforming the Employee Experience
May 15, 2026

From the Production Floor to the Negotiating Table: The Other Side of the USMCA Wage Debate
May 15, 2026